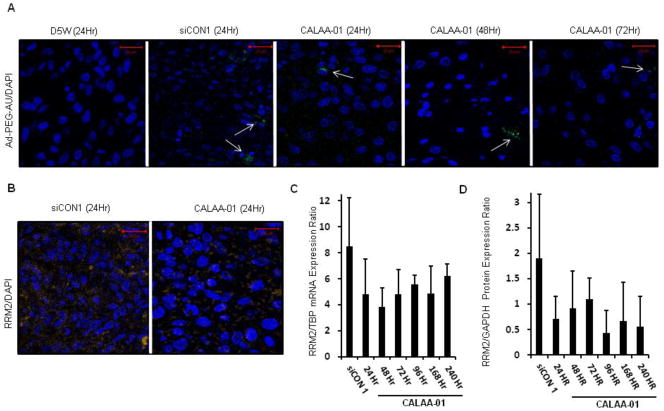
Fig. 4.
Time course of nanoparticle intratumoral residency and RRM2 expression levels in Tu212 tumors of mice treated with single intravenous dose of 5% dextrose (D5W), control siRNA-containing CDP/nanoparticle (siCON1 10mg/kg) or siR2-containing CDP/nanoparticles (CALAA-01 10mg/kg). (A) Detection of CDP/siRNA nanoparticles with Au-PEG-AD stain (green) in tumors at 24, 48, and 72 hours after treatment (white arrows point to clusters of CDP/nanoparticles; nuclei stained with DAPI in blue). (B) Immunohistochemical analysis of RRM2 protein expression (orange) 24 hours after treatment with siCON1- or CALAA-01 nanoparticles counterstained with DAPI (blue). (C) Real time qRT-PCR analysis of tumor RRM2 mRNA expression over time (siCON1 24 hr, CALAA-01 24, 48, 72, 96, 168, 240 hr) (error bars are mean +SD, n=3). (D) Western blot analysis of tumor RRM2 protein expression over time (error bars are mean +SD from 3 independent blots).

