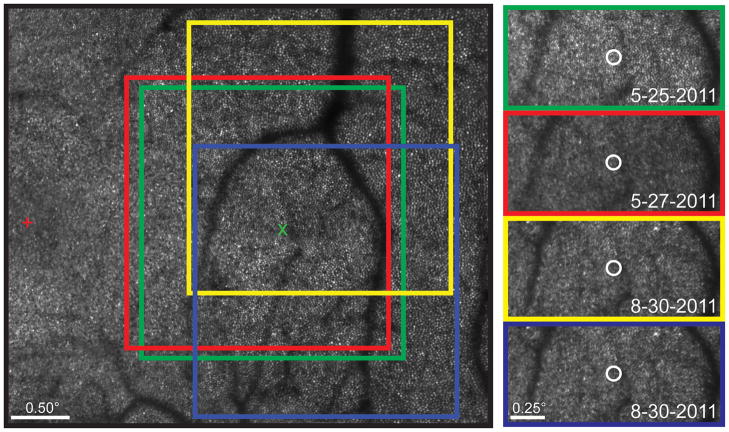
Figure 4.
Automated stimulus location recovery in Subject 3. (Left) Highlighted regions corresponding to individual reference frames used to collect stabilized retinal videos at ~2.5° retinal eccentricity. The original reference frame is outlined in green and the targeted retinal location for stimulus delivery is marked by the green “x”. To retrieve the original test location, subsequent reference frames (red, yellow, blue) are registered against the original, and the shift is used to define the targeted retinal locus in the x-y coordinates of the new reference frame. The subject’s preferred retinal locus of fixation is represented by the red cross. (Right) The Goldmann I-sized white circles are plotted at the average stimulus delivery location for a 40-trial psychophysical task performed at baseline, baseline + 2 days, and baseline + 3 months.

