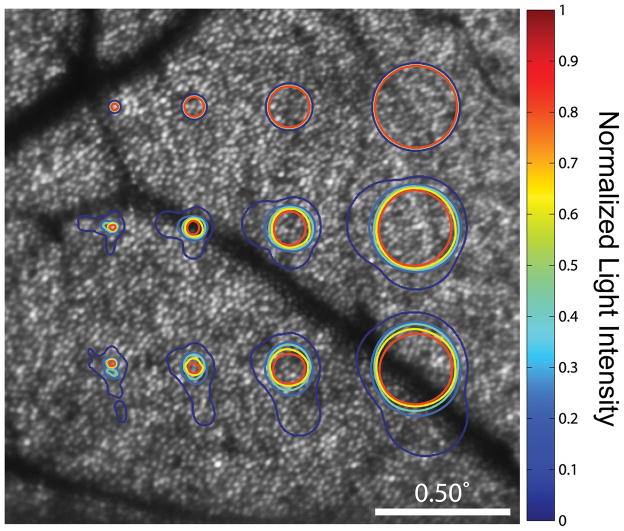
Figure 7.
Retinal light distribution of common perimetric stimuli. These distributions, which represent the spread of light on the retina of 4 perimetric stimuli, were generated by convolution of the stimulus with the point-spread function (PSF) of the diffraction-limited condition (top) and with that of two high-order aberration-uncorrected subjects (middle; bottom). PSFs were calculated for 680 nm light over a 6 mm pupil. Contour lines indicate normalized light intensities for each pixel. The innermost line (red) encircles the photoreceptors which will be stimulated by light at 99% of the intended intensity. Stimuli, from left-to-right: 2.5 arcmin circle; Goldman I; Goldmann II; Goldmann III. The retinal eccentricity is approximately 4 degrees.

