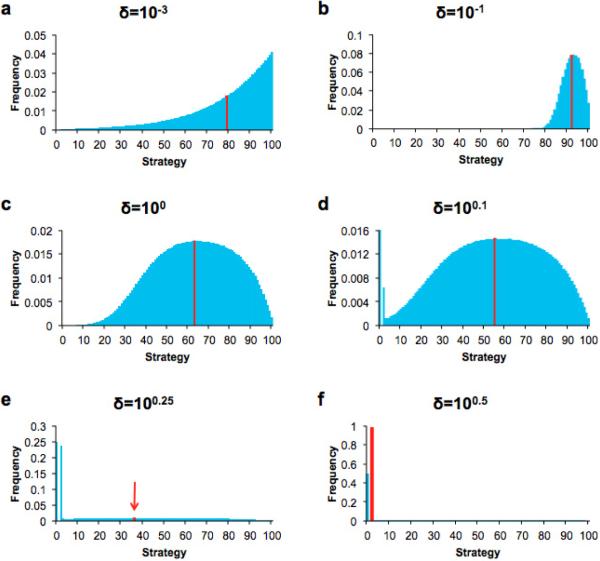
Figure 4.
The strategy distributions in the low mutation case as the selection strength varies, determined numerically with a population size of 200 (Nowak, 2006). Here R = 2 and M = 100. As the selection strength δ increases, the distribution moves from one with the weight around the “cooperative” strategies to one with the weight around the “selfish” ones. The average strategy for each distribution is marked by a red line.

