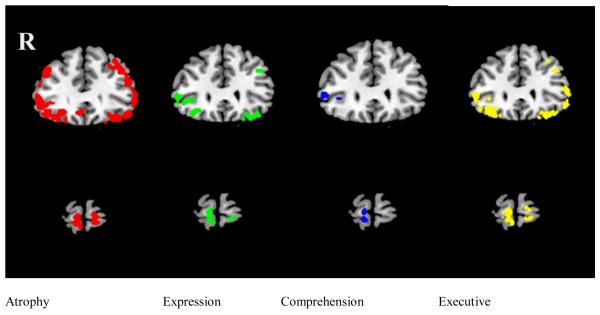
Figure 3.
Coronal slices showing correlations of measures of language production and neuropsychological test performance with cortical atrophy. Red shows region of cortical atrophy; green shows correlation of cortical atrophy with expression (search theme maintenance); blue shows correlation of cortical atrophy with comprehension (latency of within-cluster judgments); yellow shows correlation of cortical atrophy with composite executive test Z-score (average of category fluency for animals and Trails B time). Slices in the top row are at y=30; slices in the bottom row are at y=60.

