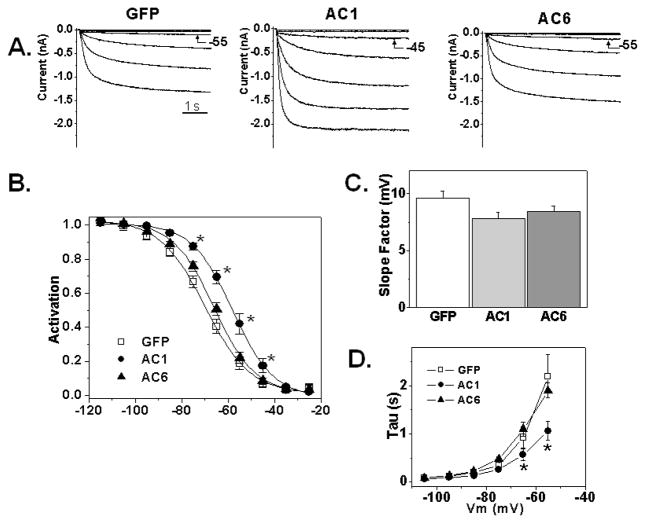
Figure 3.
Effect of over-expression of AC isoforms on HCN2 current. A. Original recordings of HCN2. The current was evoked by applying hyperpolarizing voltages from −25 to −85 mV for 5 seconds. B. Average fractional activation of measured HCN2 current. The solid lines are the fits to the Boltzmann function. AC1 activation relation differs from GFP and AC6 (p<0.001) when tested by Two Way ANOVA with Bonferroni post test for pairwise comparison. (*- p<0.001 vs GFP and AC6). C. Slope factor of activation in AdGFP, AdAC1 and AdAC6 groups. D. Kinetics of the HCN2 activation. AC1 curve differs significantly from GFP and AC6 by Two Way ANOVA (p<0.001); the asterisks (*) indicate voltages that differ from GFP by pairwise multiple comparison (Bonferroni t-test; p<0.05)

