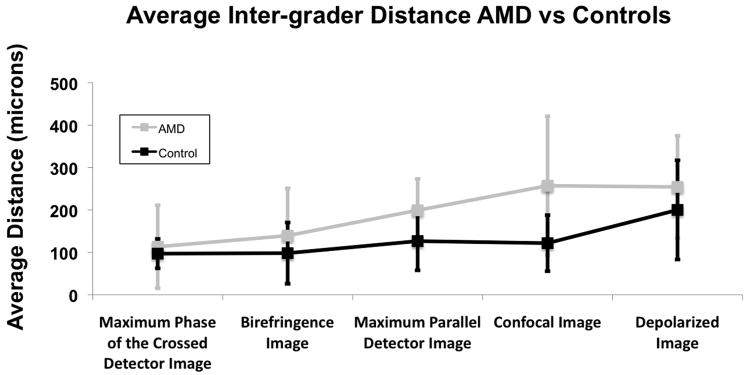
Figure 6.
The overall inter-grader variability for the 3 graders separated by image type for both the AMD and control group. The control group had less variability than the AMD group for each of the different image types. Paired t-test comparing the variability between the AMD group and the control group for each graded image demonstrated significantly more overall variability in the AMD group (p<0.001).

