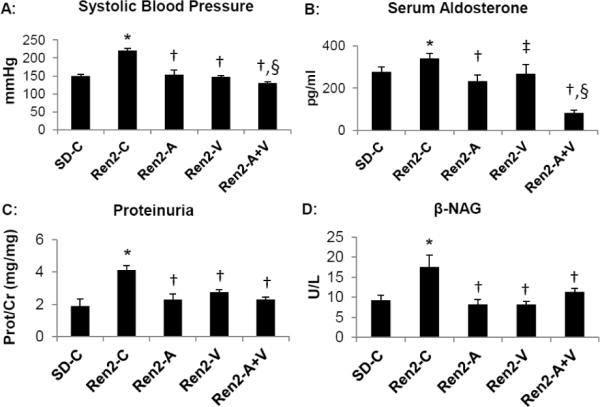
Figure 1. Experimental measures at end of treatment period in the Ren2 rat.

A) Systolic blood pressure measured by tail cuff. B) Serum aldosterone determined by radioimmunoassay. C) Proteinuria determined by urine protein to creatinine ratio. D) N-acetyl-beta-glucosaminidase (β-NAG) determined by colorimetric assay. Values presented as mean ± standard error. *, p<0.05 when Ren2 controls (Ren2-C) are compared to age-matched Sprague-Dawley controls (SD-C); †, p<0.05 when Ren2 rats treated with either aliskiren (Ren2-A), valsartan (Ren2-V), or combination (Ren2-A+V) are compared to age-matched Ren2-C; ‡, p<0.1 when Ren2-V are compared to Ren2-C; and §, p<0.05 when combination treated Ren2 rats are compared to all other groups.
