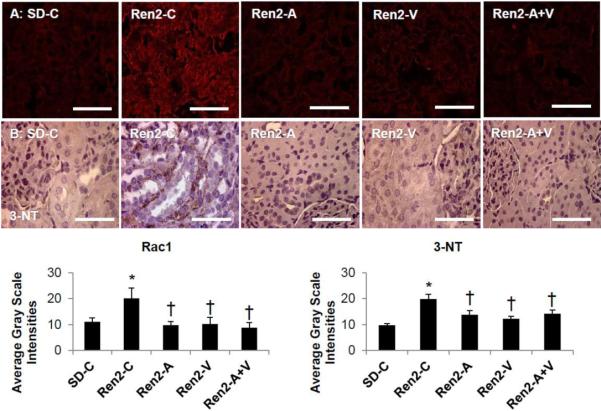
Figure 2. Semi-quantitative analysis of Oxidative Stress in the Ren2.
A) Representative images of immunohistochemistry analysis of kidney cortical tissue NADPH oxidase subunit Rac1 and B) 3-nitrotyrosine (3-NT), as a marker for lipid peroxidative and oxidative stress, with corresponding average gray-scale intensities below. Values presented as mean ± standard error. *, p<0.05 when Ren2 controls (Ren2-C) are compared to age-matched Sprague-Dawley controls (SD-C); †, p<0.05 when Ren2 rats treated with either aliskiren (Ren2-A), valsartan (Ren2-V), or combination (Ren2-A+V) are compared to age-matched Ren2-C. Scale bar = 50 μm.

