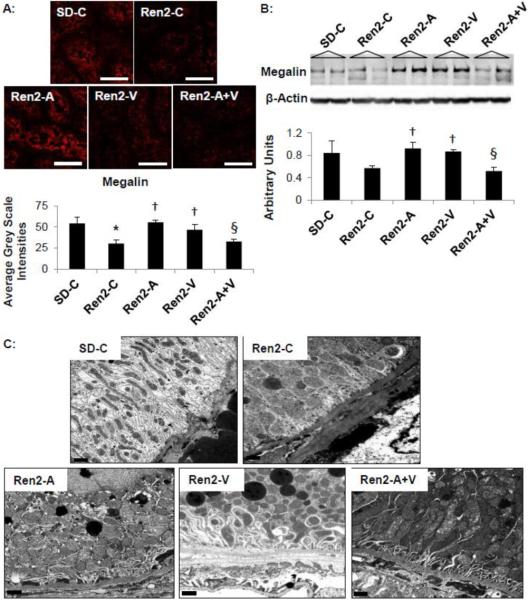
Figure 3. Proximal tubule protein handling in the Ren2.
A) Representative images from immunohistochemistry analysis of megalin with corresponding measures to the below. Scale bar = 50 μm. B) Western blot analysis of megalin. Values presented as mean ± standard error. *, p<0.05 when Ren2 controls (Ren2-C) are compared to age-matched Sprague-Dawley controls (SD-C); †, p<0.05 when Ren2 rats treated with either aliskiren (Ren2-A), valsartan (Ren2-V), or combination (Ren2-A+V) are compared to age-matched Ren2-C; §, p<0.05 when combination treated Ren2 rats are compared to aliskiren or valsartan treatment. C) Representative images from ultrastructural analysis utilizing transmission electron microscopy for the S-1 region of the PTC. Images depict from Ren2-C (top right panel) demonstrate very little endosomal lysosomal activity with decreased clathrin coated pits, endosomes, and apical vacuoles within the endosomal regions as compared to SD-C (top left panel). Note that Ren2-A (bottom left panel), Ren2-V (bottom middle panel), and Ren2-A+V (bottom right panel) restore these decreased entities. Scale bar = 0.2 μm.

