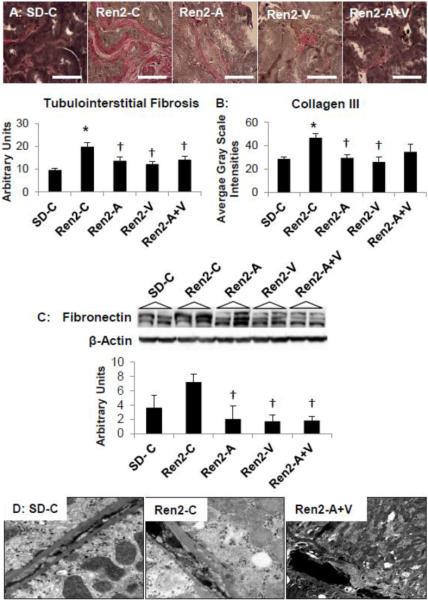
Figure 4. Tubulointerstitial Fibrosis in the Ren2.
A) Verhoeff-Van Gieson (VVG) stain for elastin and collagen with measures of tubulointerstitial fibrosis below. Scale bar = 50 μm. B) Immunohistochemistry analysis of collagen type III. C) Western blot analysis of fibronectin. Values presented as mean ± standard error. *, p<0.05 when Ren2 controls (Ren2-C) are compared to age-matched Sprague-Dawley controls (SD-C); †, p<0.05 when Ren2 rats treated with either aliskiren (Ren2-A), valsartan (Ren2-V), or combination (Ren2-A+V) are compared to age-matched Ren2-C. Scale bar = 50 μm. D) Representative images from ultrastructural analysis of transmission electron microscopy for the S-1 region of the proximal tubule. Images depict depicts loss of basal polarity with elongated canalicular plasma membrane infoldings and mitochondria, and basement membrane (BM) thickening in the basal region of the R2-C (middle panel) compared to SD-C (left panel), findings improved only with combination Ren2-A+V (right panel) and not in Ren2-A and Ren2-V as depicted in Figure 2C. Scale bar = 0.2 μm

