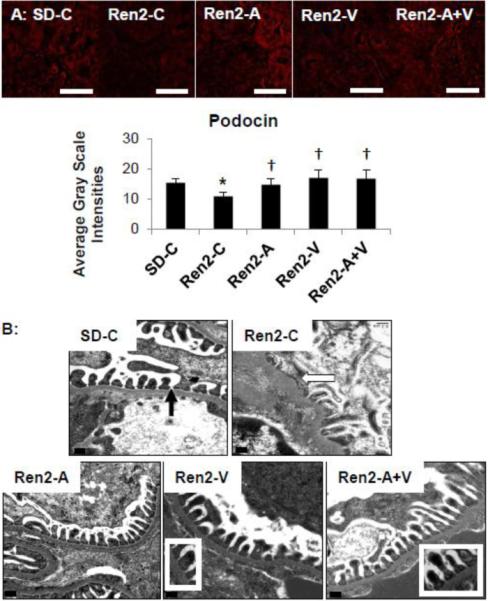
Figure 5. Podocyte Foot Process Integrity in the Ren2.

A) Representative images of immunohistochemistry analysis of the podocyte specific protein podocin with corresponding measures below. Values presented as mean ± standard error. *, p<0.05 when Ren2 controls (Ren2-C) are compared to age-matched Sprague-Dawley controls (SD-C); †, p<0.05 when Ren2 rats treated with either aliskiren (Ren2-A), valsartan (Ren2-V), or combination (Ren2-A+V) are compared to age-matched Ren2-C. Scale bar = 50 μm. B) Representative images from ultrastructural analysis of transmission electron microscopy for the glomerular filtration barrier on transmission electron microscopy. Images depict Ren2-C (top right panel) displays loss of glomerular filtration barrier integrity with podocyte foot-process effacement and loss of the slit-pore diaphragm (arrows) compared to SD-C (top left panel). Note that Ren2-A (bottom left panel), Ren2-V (bottom middle panel), and Ren2-A+V (bottom right panel) restore these findings (inserts). Scale bar = 0.2 μm
