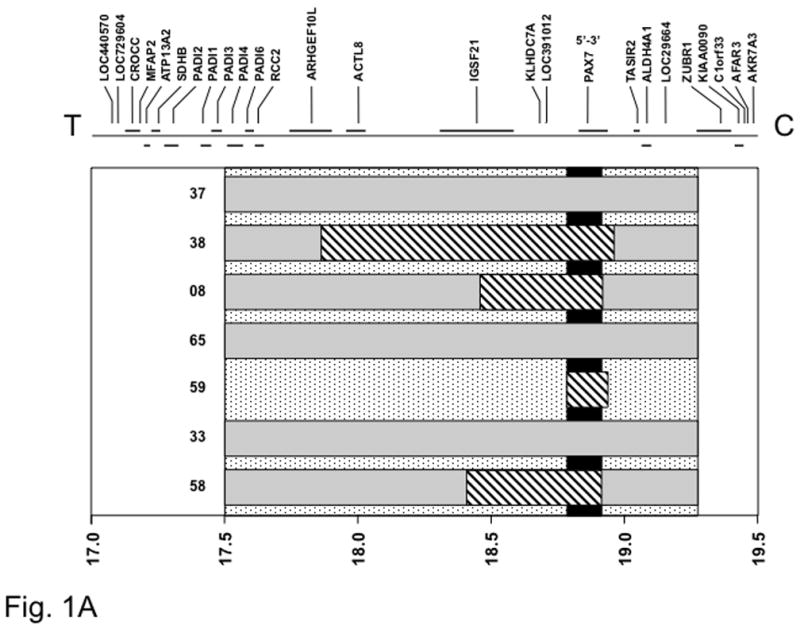
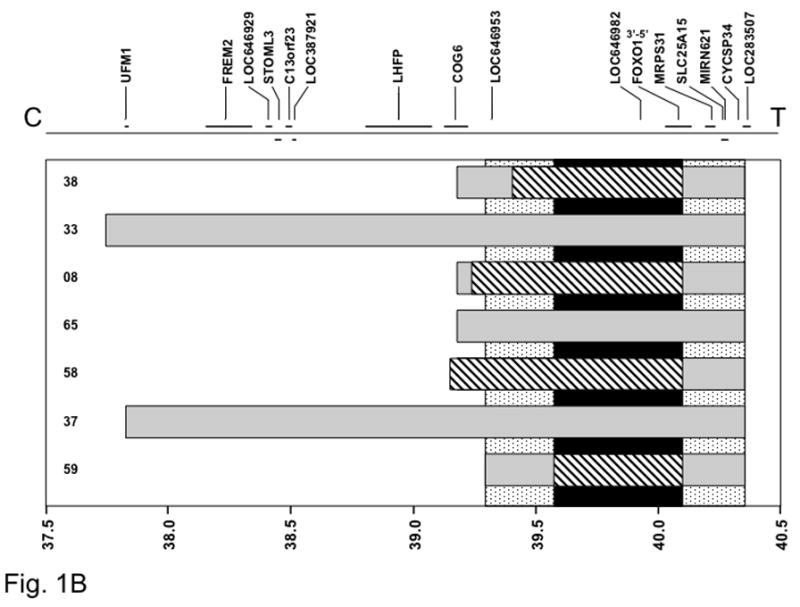
Figure 1. Localization of the minimal common amplified regions in 1p36 (A) and 13q14 (B) chromosomal regions.


The gray rectangles indicate the extent of amplification measured in each tumor using the Affymetrix GeneChip 50K array. The stippled vertical bar indicates the minimal common area of amplification based on this initial mapping data using the 50K array. The diagonal-striped rectangles indicate further localization of the amplicons in a selected set of tumors using the Affymetrix GeneChip 250K array. The black vertical bar indicates final localization of the minimal common area of amplification based on this more detailed analysis. At the top, genes present in the 1p36 (A) and 13q14 (B) regions are shown, based on NCBI Build 36.2 of the human genetic map, and at the bottom, a scale of genomic position (in megabases) is shown. The positions of the chromosome 1 (A) or 13 (B) centromere and 1p (A) or 13q (B) telomere are designated as C and T, respectively. The 5′ to 3′ transcriptional orientation of PAX7 (A) and FOXO1 (B) are also shown above the corresponding genes.
