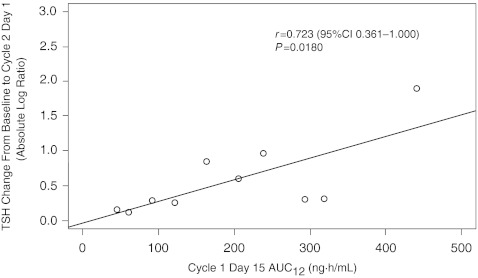
Fig. 4.
Relationship between change in thyroid-stimulating hormone (TSH) levels from baseline to cycle 2 day 1 (absolute log ratio) and AUC12 in Studies 1 and 2 (pooled data): n = 10—eight patients were excluded (two with abnormal baseline TSH; three received thyroid hormone replacement therapy or had axitinib dose titrated before cycle 2 day 1; two discontinued treatment before cycle 2 day 1; and one did not receive cycle 1 day 14 am dose). AUC 12 area under the plasma concentration–time curve from time zero to 12 h; CI confidence interval

