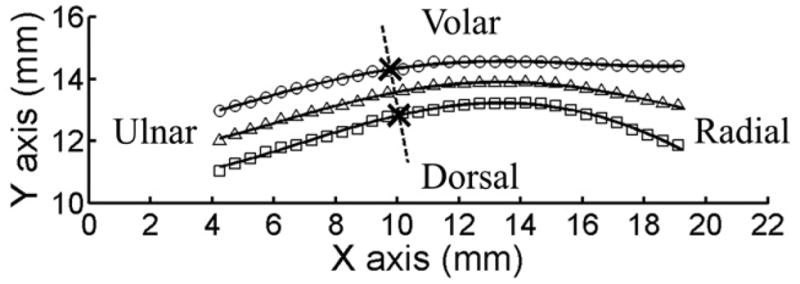
Figure 2.

A representative, digitalized outline of the TCL for thickness calculation. The interpolated volar and dorsal boundaries of the TCL are indicated by symbols ○, and □, respectively. Symbol △ indicates the middle points derived from corresponding volar and dorsal data. For clarity, the symbols are shown every 7 pixels. The solid lines represent the fitted fourth-order polynomials. The dotted line is perpendicular to the fitted middle line of the TCL. The intersection points between the dotted line and the fitted volar and dorsal curves of the TCL are indicated by ‘×’. The TCL thickness at this location is 1.51 mm measured as the distance between the two intersection points.
