
Figure 2.
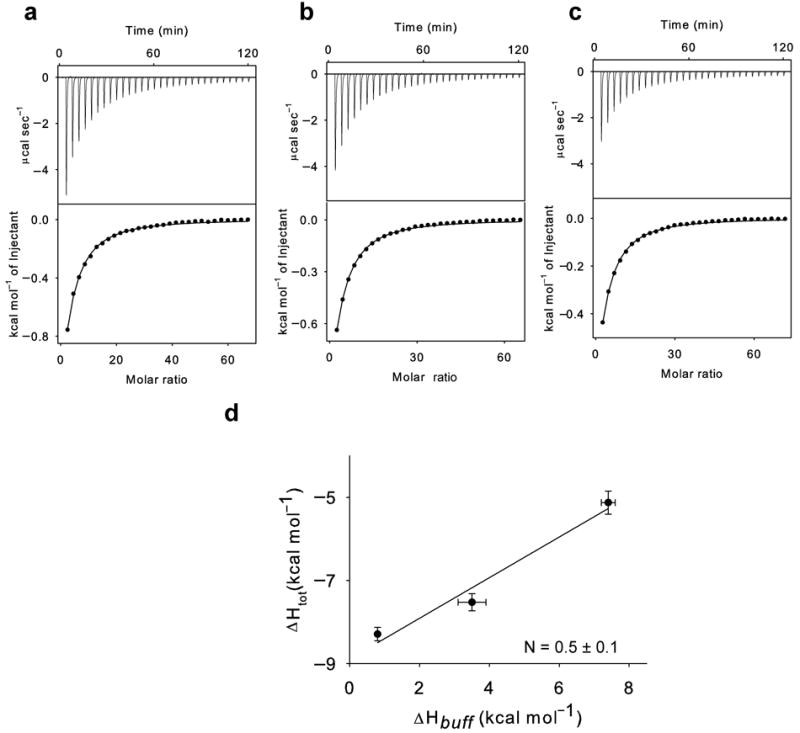
Synergistic binding of H+ and Cl− to WT CLC-ec1. (a-c): Top panels: heat liberated when a 25 mM KCl solution is injected into the experimental chamber containing protein and Phosphate (a), Hepes (b) and Tris (c). Each downward deflection corresponds to one injection. Bottom panels: the area underneath each deflection is integrated and represents the total heat exchanged (squares). Black lines are the best fits to a single site binding isotherm. The averaged thermodynamic parameters are reported in Table 1. d) Plot of the total enthalpy of Cl− binding, ΔHtot, as a function of the enthalpy of buffer ionization, ΔHbuff. Squares: experimental data. Solid line: fit to Eq. 1 with ΔHprot = −8.9±0.4 kcal mol−1 and N = 0.5±0.1. The errors for the experimental points are the s.e.m. while those on ΔHprot and N represent the uncertainty of the fit.