Fig. 3.
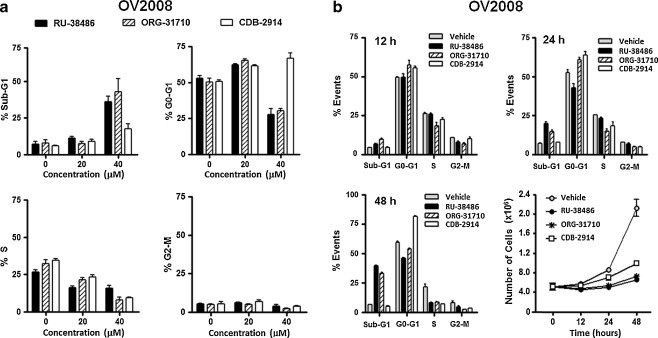
Effect of antiprogestins on cell cycle distribution in OV2008 cells. a Logarithmically growing OV2008 ovarian cancer cells were exposed to 0, 20 or 40 μM RU-38486, ORG-31710 or CDB-2914 for 72 h. The percentage of cells with Sub-G1 DNA content (upper left), or with DNA content consistent with G0-G1 (upper right), S (lower left), and G2-M (lower right) phases of the cell cycle was determined by microcapillary cytometric analysis after propidium iodide staining of the DNA. b Logarithmically growing OV2008 cells were exposed to DMSO (vehicle) or 40 μM antiprogestins for 12 h (upper left), 24 h (upper right), or 48 h (lower left). The percentage of events consistent with Sub-G1, G0-G1, S, and G2-M DNA content was analyzed after propidium iodide staining utilizing microcapillary cytometry. The number of cells was recorded at the beginning of the experiment and after different periods of incubation with or without treatments (lower right)

