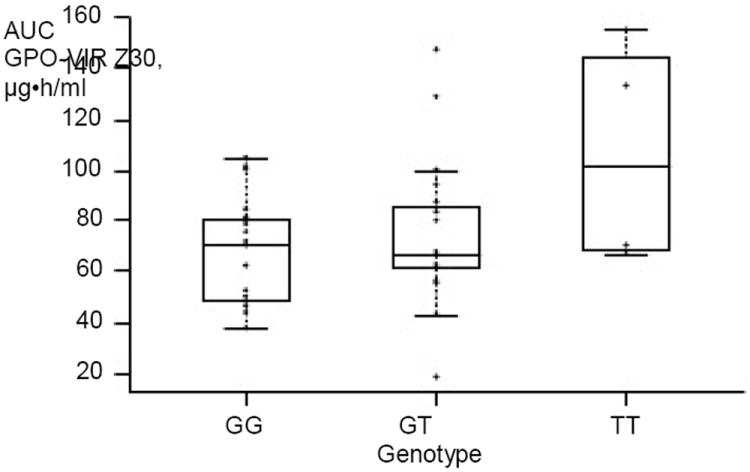
Figure 2.

Nevirapine plasma exposure and CYP2B6 516 G>T polymorphisms after administration of GPO-VIR Z30 in HIV-infected Thai children
Comparison of GG versus GT versus TT genotypes, P=0.04. Each circle represents one child, the middle bar indicates the median, and the box represents the IQR. AUC, area under the curve.
