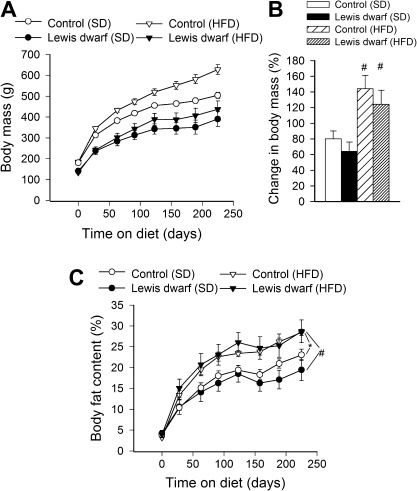
Figure 1.
(A) Changes in body mass of Lewis dwarf rats and control rats fed a high-fat diet (HFD) or standard diet (SD). Each time point represents the average body mass of each group. (B) Shows percentage change in body mass. Data are means ± SEM (n = 5–7); #p < .05 versus SD. (C) Body composition expressed as percent fat mass in Lewis dwarf rats and control rats fed a HFD or SD. HFD-fed rats of each genotype had significantly more body fat than those fed an SD. Data are means ± SEM (n = 5–7). *p < .05 versus control (SD); #p < .05 versus Lewis dwarf (SD).

