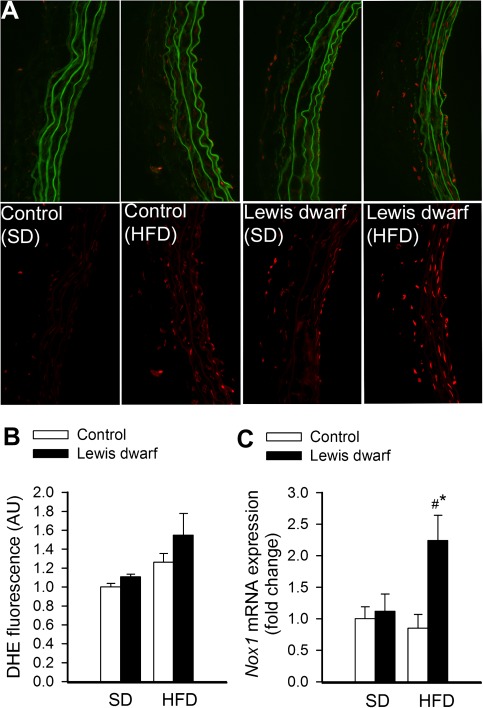
Figure 5.
Representative micrographs showing red nuclear dihydroethidium (DHE) fluorescence, representing cellular production, in sections of cultured aortas isolated from Lewis dwarf rats and control rats fed a high-fat diet (HFD) or standard diet (SD). For orientation purposes, overlay of DHE signal and green autofluorescence of elastic laminae is also shown (upper panels). Original magnification: 20×. (B) Summary data for nuclear DHE fluorescence intensities. Data are mean ± SEM. (C) Quantitative real-time reverse transcription–polymerase chain reaction data showing messenger RNA expression of Nox1 in the aortas of HFD-fed and SD-fed Lewis dwarf rats and control rats. Data are mean ± SEM (n = 5–7). *p < . 05 versus SD-fed Lewis dwarf; #p < . 05 versus HFD-fed controls.

