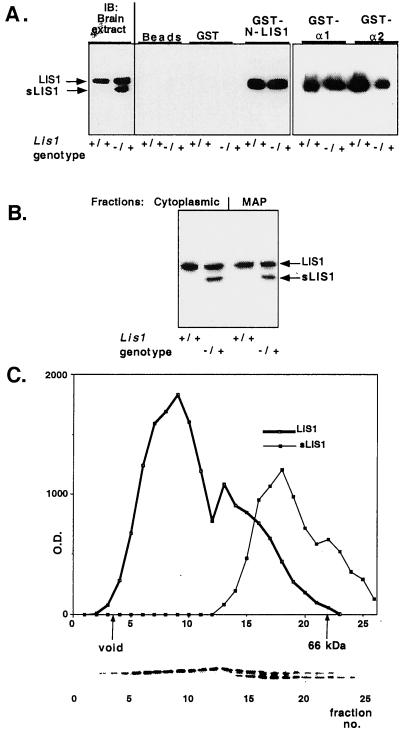
Figure 5.
LIS1 and sLIS1 interactions. (A) sLIS1 does not homodimerize and or interact with PAF-AH catalytic subunits. LIS1 homodimerization and PAF-AH catalytic subunits: negative controls include glutathione coated agarose beads, and GST protein show the specificity of the reaction. Western blots (IB) from brain extracts of Lis1+/+ and Lis1/sLis1 (genotype −/+) mice are shown (Left) for comparison. The genotypes are marked under the panels. The interacting proteins were reacted with anti-LIS1 monoclonal antibody (clone 210). (B) sLIS1 assembles with microtubules. Distribution of LIS1 isoforms between the cytoplasmic and microtubule-associated protein fractions. Protein extracts from normal or mutant mouse brains were subjected to microtubule assembly. A representative Western blot by using anti-LIS1 antibodies is shown. The fractions: the two LIS1 isoforms and the genotypes are indicated. (C) Gel filtration analysis of LIS1 and sLIS1. sLIS1 is associated with smaller macromolecular complexes than normal LIS1. Brain extract from heterozygous Lis1/sLis1 mice was size-fractionated by a Sephadex-75 column. Proteins from each fraction were separated by SDS/PAGE and reacted with anti-LIS1 antibody (clone 210). The amount of LIS1 protein was quantified by densitometer (y axis) and plotted against fraction number (x axis). The positions of the void volume and 66 kDa (BSA) markers are shown. The distribution of the normal LIS1 is shown in a thick line, and the distribution of sLIS1is shown by a thin line. (Lower) Representative Western blot.

