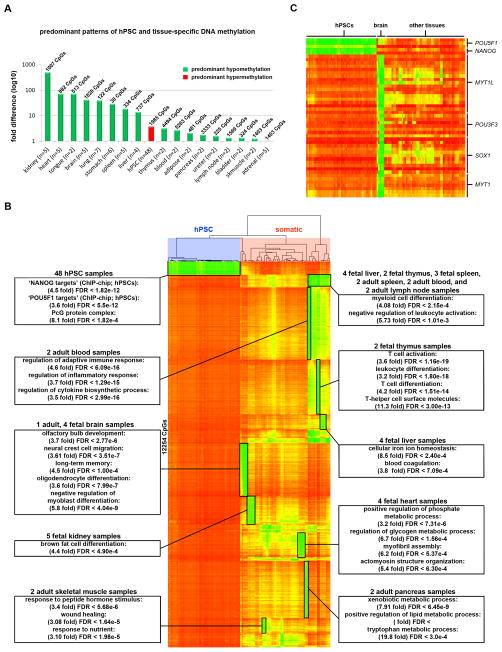
Figure 2. Tissue-specific patterns of DNA methylation.
Data for CpG sites on the 450K DNA Methylation array that were differentially methylated between samples from a given tissue and all other samples (Δβ > 0.5) are shown. A. The histogram shows the fold difference in total number of uniquely hypomethylated and hypermethylated CpGs for a given tissue (listed in Table S3). If hypomethylated CpGs predominate, the bar is green; if hypermethylated CpGs predominate, the bar is red. The total number of unique CpGs that were differentially methylated in the given tissue type is shown above each bar, and the total number of samples per tissue type is shown on the X-axis. B. 12,254 CpGs on the 450K DNA Methylation array with uniquely hypomethylated CpGs in specific tissue types. Functional enrichments for tissue-specific hypomethylated clusters are identified with boxes. Samples are grouped according to hierarchical clustering and CpGs are rank-ordered for each tissue (see also Table S3). C. DNA methylation of pluripotency- and neural-specific transcription factor genes.

