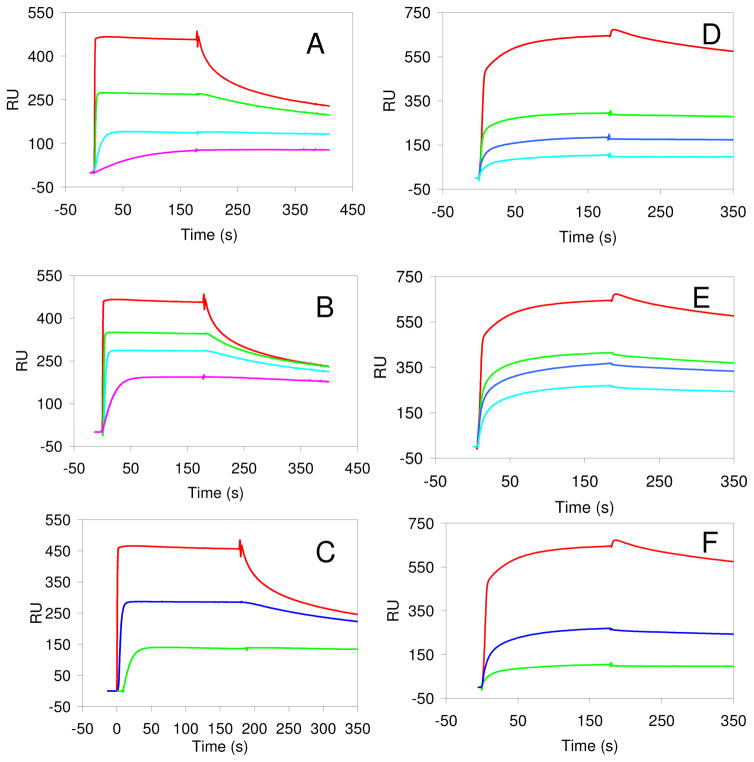
Figure 2.
A. The inhibition of FGF2 binding to immobilized heparin by sized heparin oligosaccharide mixtures, control (no oligosaccharides) in red, dp6 in green, dp8 in blue, and dp10 in turquoise. B. The inhibition of FGF2 binding to immobilized heparin chip by sized 6-desulfated heparin oligosaccharide mixtures, control (no oligosaccharides) in red, dp6 in green, dp8 in blue, and dp10 in turquoise. C. Comparison of the inhibition of FGF2 binding to immobilized heparin by dp10 oligosaccharide mixtures: red, control; blue, 6-desulfated heparin dp10; green: heparin dp10. D. The inhibition of FGF2•FGFR1 binding to immobilized heparin by sized heparin oligosaccharide mixture, control (no oligosaccharides) in red, dp6 in green, dp8 in blue, and dp10 in turquoise. E. The inhibition of FGF2•FGFR1 binding to immobilized heparin by sized 6-desulfated heparin oligosaccharide mixture, control (no oligosaccharides) in red, dp6 in green, dp8 in blue, and dp10 in turquoise. F. Comparison of the inhibition of FGF2•FGFR1 binding to immobilized heparin by dp10 oligosaccharide mixtures: red, control; blue, 6-desulfated heparin dp10; green: heparin dp10. The concentrations of FGF2, FGF2•FGFR1 complex, and the oligosaccharide were 1000, 500, and 2000 nM, respectively.

