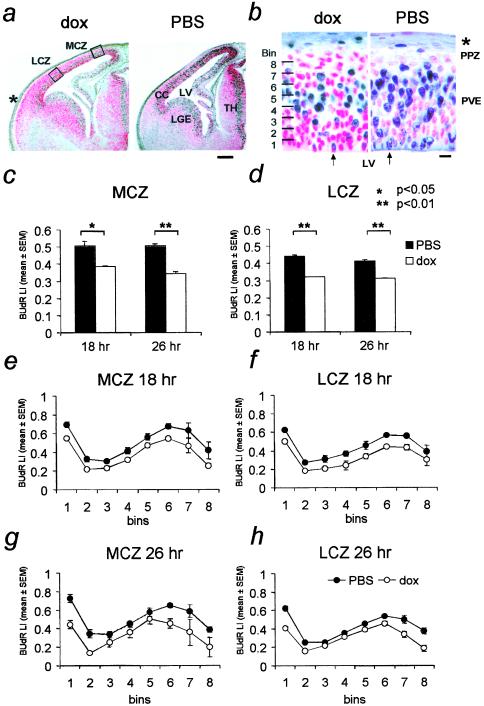
Figure 4.
Analysis of BrdUrd LI in the neocortical PVE of E13 embryos. (a) BrdUrd in E13 forebrains. BrdUrd-labeled nuclei are black and non-BrdUrd-labeled nuclei are red. BrdUrd LI was analyzed at the MCZ and the LCZ. (b) High-power view of the MCZ shown in a, to illustrate the reduction in BrdUrd labeling in dox-exposed forebrain. Arrows show BrdUrd-labeled mitotic Fig. 2 h BrdUrd LI in the MCZ (c) and the LCZ (d) after 18 h or 26 h of dox exposure. The reduction in BrdUrd LI occurred throughout the PVE, in each of the 10 bins at 18 h (e and f) and 26 h (g and h). *, P < 0.05; **, P < 0.01. LV, lateral ventricle; LGE, lateral ganglionic eminence; TH, thalamus; CC, cerebral cortex; PPZ, primordial plexiform zone; PVE, pseudostratified ventricular epithelium. * in a and b indicates skull and skin. (Scale bar: a = 200 μm; b = 10 μm.)

