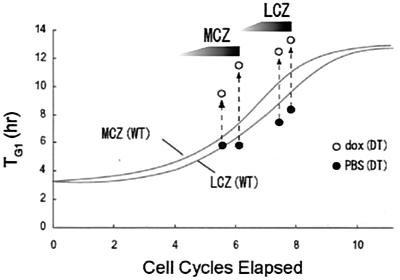
Figure 5.
A schematic illustration of the effects of p27Kip1 transgene expression on TG1 in the neocortical PVE. TG1 (ordinate) in LCZ and MCZ of dox-exposed (○) and PBS-exposed (●) E13 embryos is plotted against elapsed cell cycle numbers of the 11-cell-cycle neocortical neuronogenetic interval (abscissa). The continuous traces (Upper, MCZ; Lower, LCZ) correspond to TG1 progression in WT mice (12). The broken upward arrows represent the apparent augmentation of TG1. The 18-h and 26-h time points correspond to late cell cycle number 6 and early cell cycle number 7, respectively, for the MCZ and to successively later stages of cell cycle number 8 for the LCZ. The graded shading in the wedges represents the relative advance of p27Kip1 overexpression with respect to the state of the cell cycle.

