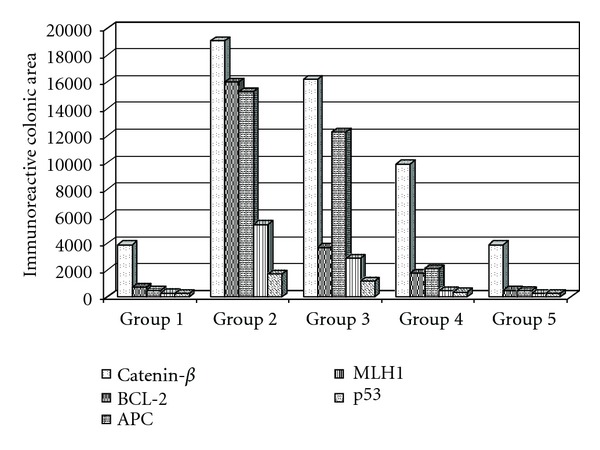
Figure 5.

Image analysis of the mean value of colorectal damage area marked by immunoreactivity in mice groups. Group 5 showed a significantly difference (P < 0.05) to the other treatment groups (3 and 4), and a similar mean value when compared with negative control (group 1).
