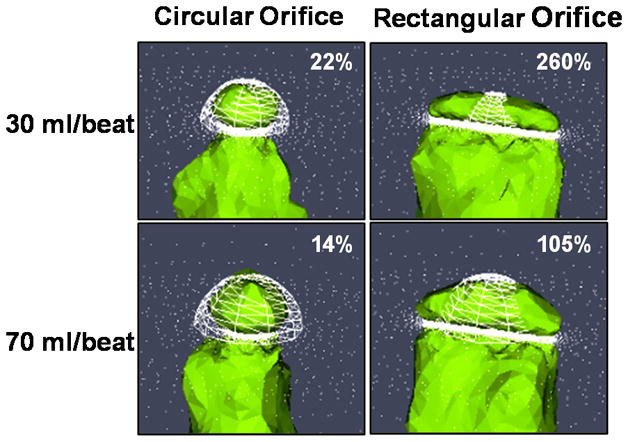
Figure 11.

Comparison of 2D Doppler and 3D CFD Proximal Isovelocity Surface Area. Simulated PISA for two orifice shapes under moderate (30ml/beat) and severe (70ml/beat) flow conditions. Compared the 3D CFD model (green), the 2D Doppler method (white mesh) relies upon a single radius measurement and appears to overestimate PISA for the circular office and underestimate PISA for the rectangular orifice. The percent relative difference between 2D PISA and 3D CFD PISA is given for each flow condition. In each image the flow direction is top to bottom and the plane of the orifice is indicated by the white bar at the bottom of the mesh.
