Figure 5.

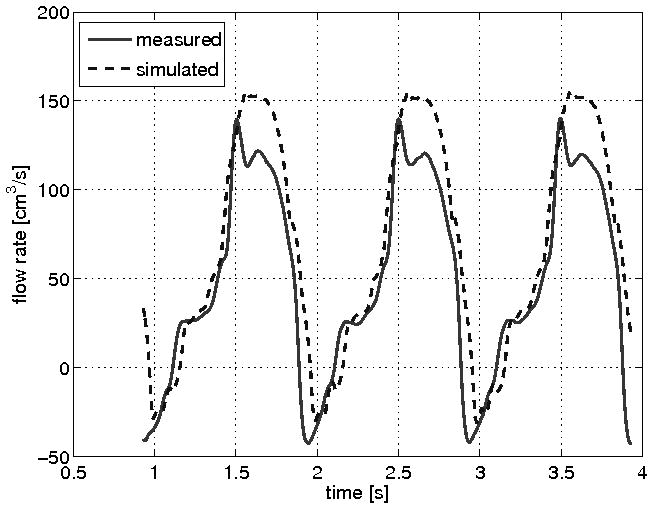
Comparison of flow rate across a circular orifice. CFD simulation of flow (dashed blue line) compares well with flow measured immediately downstream from the imaging chamber (solid red line).

Comparison of flow rate across a circular orifice. CFD simulation of flow (dashed blue line) compares well with flow measured immediately downstream from the imaging chamber (solid red line).