


Figure 7.
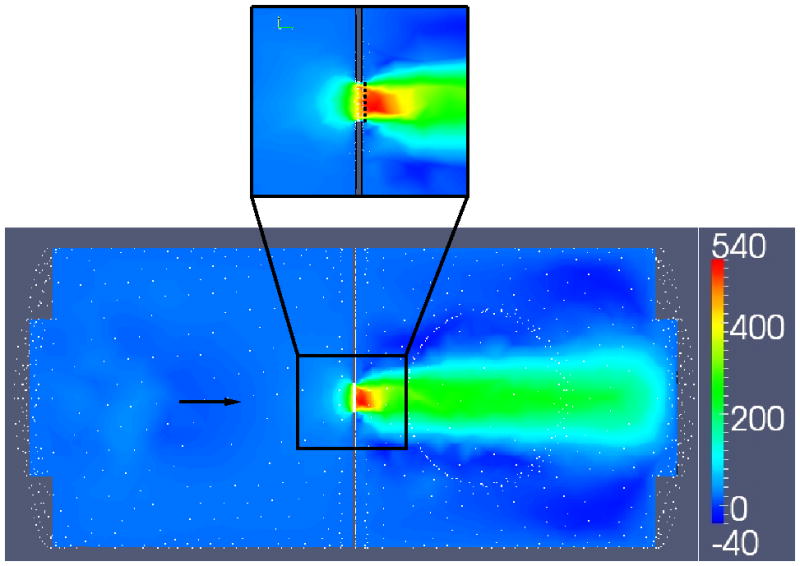
Display of computational flow velocities within the imaging chamber. Colors indicate the magnitude of the axial component of the velocity in cm/s. A) depicts the entire flow chamber. B) Shows a magnified view near the orifice with a dotted white line indicating the vena contracta. The black arrows indicates flow direction, from left to right.