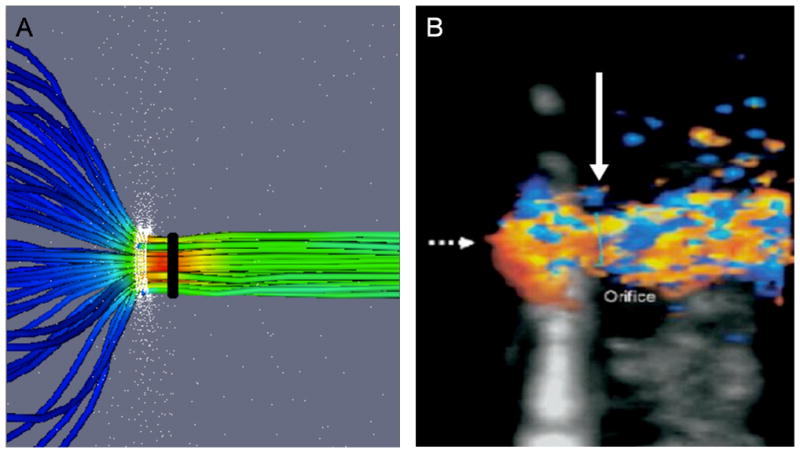
Figure 8.

A comparison of flow convergence and vena contracta, as depicted by CFD modeling and 3D color Doppler. A) CFD depicts converging upstream streamlines and the distal vena contracta region. The orifice is circular (white band) and the vena contracta diameter (black) is shown. B) 3D Color Doppler (orthogonal long-axis view with US probe at top) demonstrating a converging isovelocity “hemisphere” (broken arrow) and vena contracta (solid white arrow). This standard clinical view is optimal for VC imaging (maximal axial resolution) but suboptimal for flow convergence imaging (large Doppler angle, ~ 90°).
