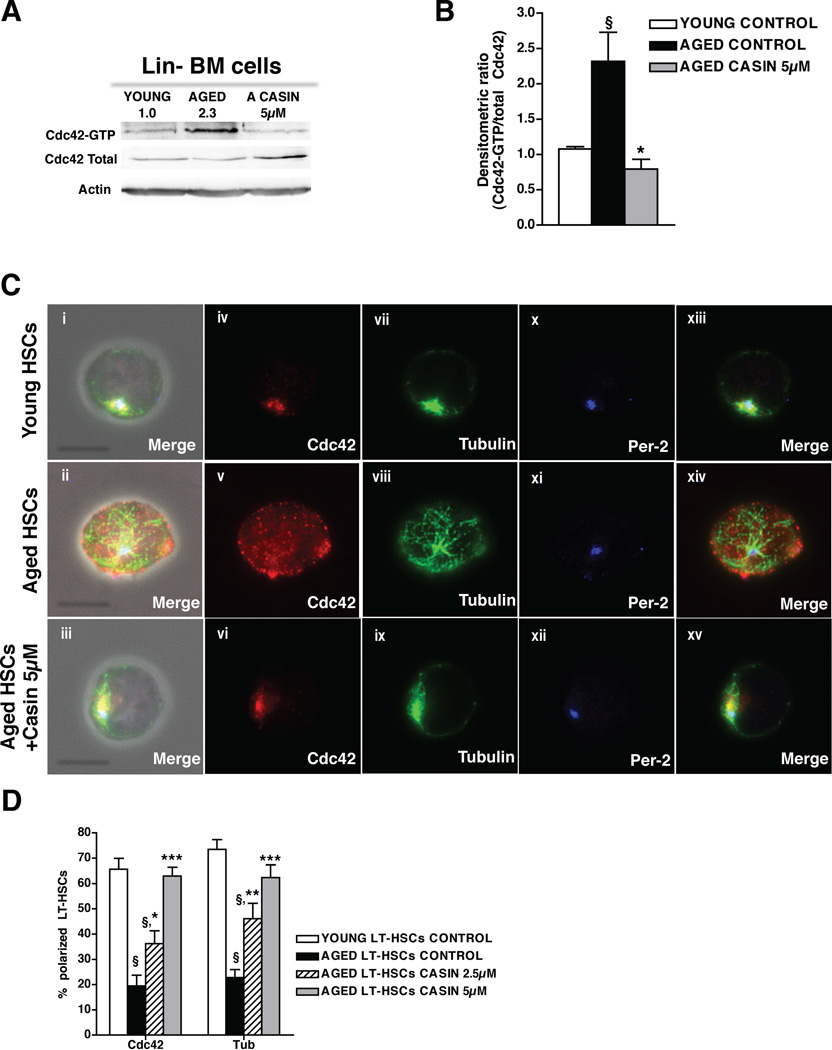
Figure 3. Pharmacological targeting of Cdc42 reverts aged apolar LT-HSCs to polar cells.
(A), Representative Cdc42 activity in young, aged and CASIN (5 µM) treated aged lineage depleted bone marrow (Lin−BM) as determined by a pulldown/Western Blot assay. Active Cdc42 (Cdc42-GTP) was normalized with respect to total Cdc42 and actin as delineated by the numbers. (B), Ratio of the densitometric score of the Cdc42-GTP form and the total Cdc42 expression. Shown are mean +1 S.E., n=3, § p < 0.05 vs young control; *p < 0.05 vs. aged control. (C), Representative distribution of Cdc42, tubulin and Per-2 in young, aged and aged LT-HSCs treated with 5µM CASIN. Shown are overlaps with the phase contrast picture (panels i–iii) or cells on a dark background (panels iv–xv). Bar = 5µm. (D), Percentages of cells polarized for Cdc42 and tubulin in young, aged and aged LT-HSCs treated with 2.5 and 5µM CASIN. For each sample cells were singularly analyzed and scored for Cdc42 and tubulin polar distribution. Shown are mean mean +1 S.E., n=4, ~200–300 cells scored per sample in total. § p < 0.001 vs young control; *** p < 0.001 vs. aged control, ** p < 0.01 vs. aged control, * p < 0.05 vs. aged control. See also Figure S3.

