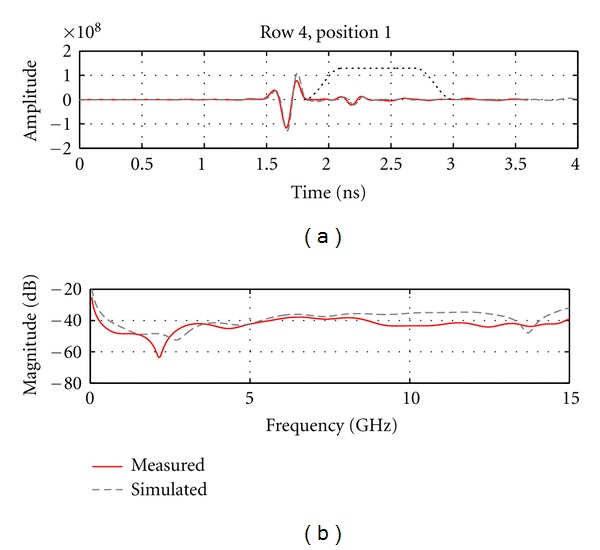
Figure 13.

(a) Calibrated reflection from the breast model recorded by the antenna situated the closest to the inclusion. Dotted line shows the extent of the Tukey window that is used to isolate the later-time response. (b) The frequency response of the later-time component of the signals.
