
Figure 15.
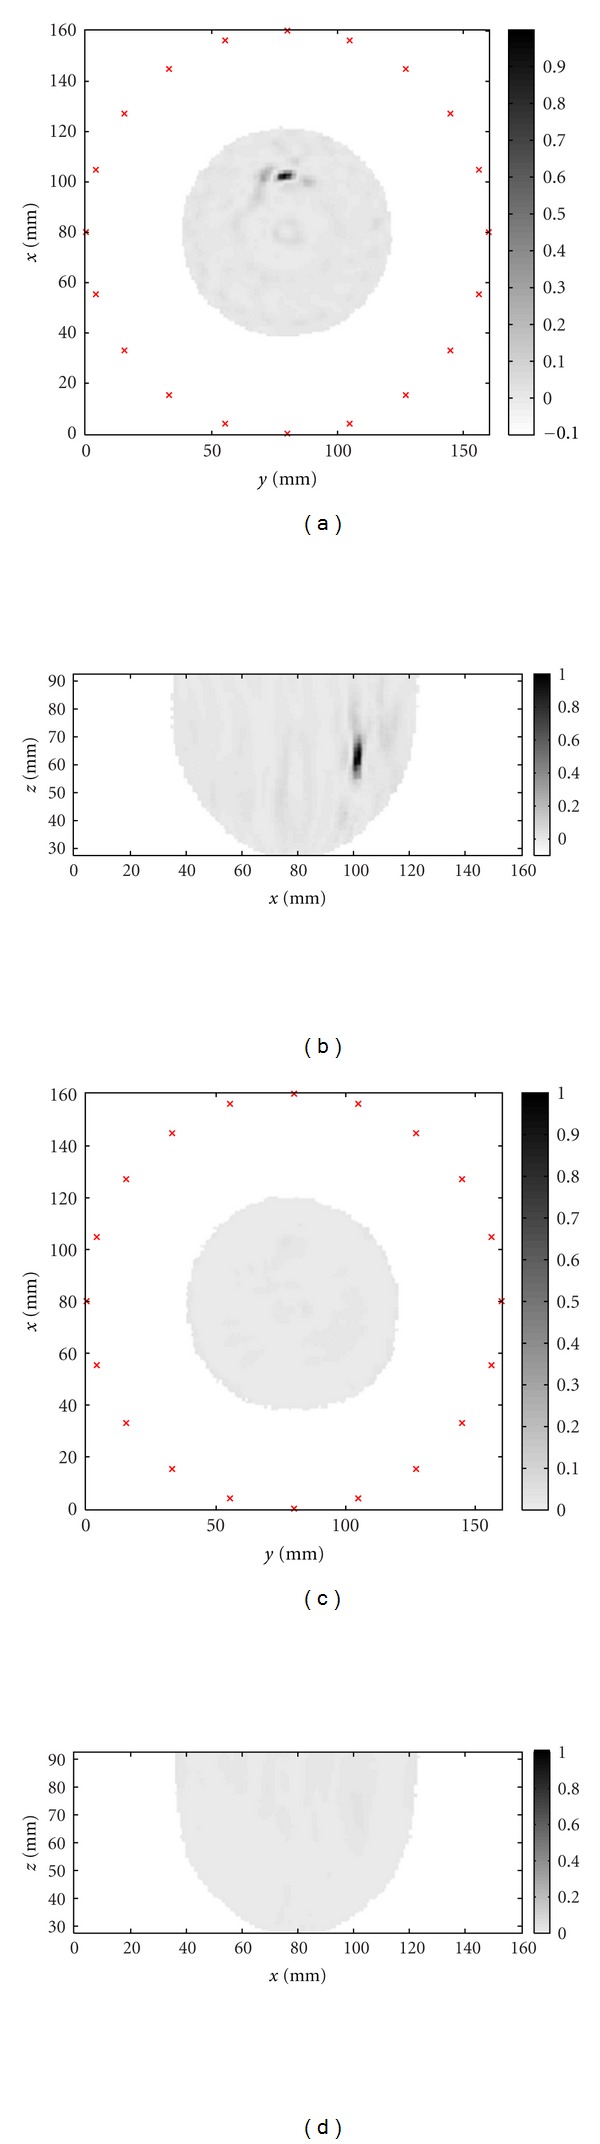
Images of the hemispherical model created from measured data: (a) slice through the inclusion location perpendicular to the axis of the cylinder and (b) slice through the inclusion location parallel to the axis of the cylinder. The images for the phantom without the inclusion are shown in (c) and (d).