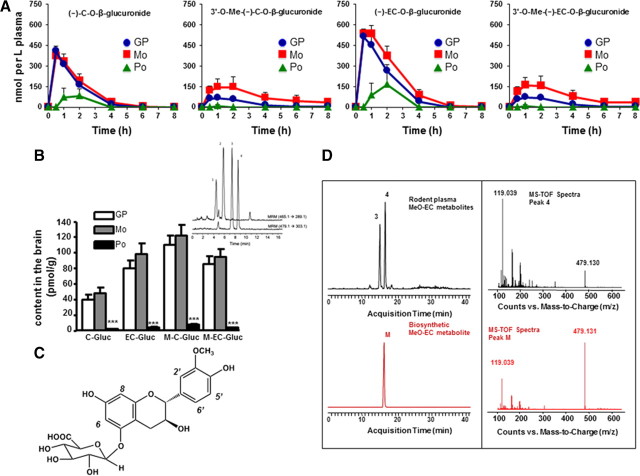
Figure 2.
Plasma pharmacokinetics, brain levels of C and EC metabolites, and structural characterization of biosynthetic EC metabolite. A, Plasma pharmacokinetic profile of major C and EC metabolites following repeated dosing of rats by treatment with GP, Mo, and Po. B, Concentration of C and EC metabolites in brain tissue following 10 d of treatment. Inset, LC-MS/MS separation of major C and EC metabolites detected in extracts of rat brain tissue collected after 10 d of treatment. MRM trace is shown for C/EC-O-β-glucuronide (465.1→289.1 m/z) and MeO-C/EC-O-β-glucuronide (479.1→303.1 m/z). Peak identifications: peak 1: (±)-C-O-β-glucuronide; peak 2: (-)-EC-O-β-glucuronide; peak 3: 3′-O-Me-(±)-C-O-β-glucuronide; peak 4: 3′-O-Me-(-)-EC-O-β-glucuronide. ***p < 0.001, n = 5 per group. C, Proposed structure of the primary EC metabolite identified as 3′-O-Me-(-)-EC-5-O-β-glucuronide present in blood and brain tissues following repeated dosing of rats by treatment with GP or Mo fraction. D, LC-MS-TOF separation and online spectra of C and EC metabolites detected in extracts of rat plasma (black) and biosynthetic EC metabolite (red). Extracted ion chromatogram is shown for MeO-C/EC-O-β-glucuronide (479.13). Peak identifications: peak 3: 3′-O-Me-(±)-C-5-O-β-glucuronide; peak 4: 3′-O-Me-(-)-EC-5-O-β-glucuronide; peak M: 3′-O-Me-(-)-EC-5-O-β-glucuronide.

