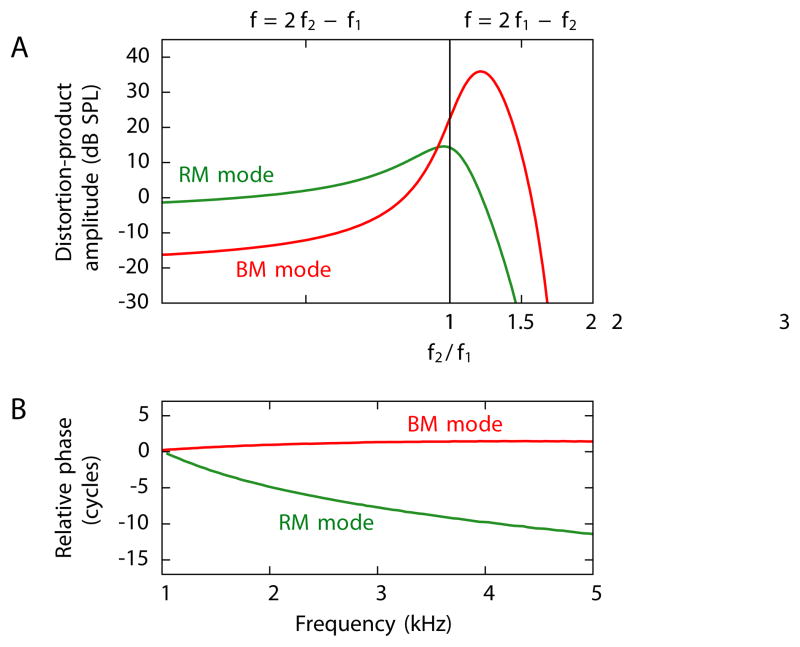
Figure 5. Experimentally observable results from a computational model.
(A) The pressures of the distortion products at the stapes differ strikingly for emissions through the two modes. When the primary frequencies are near one another, emission through the Reissner’s membrane mode (green) has an approximately equal amplitude for the upper and the lower sidebands. Emission through the basilar-membrane mode (red), however, is much stronger at the lower sideband than at the upper sideband. (B) The emissions at the frequency 2f1 − f2 through the two modes show distinct phase changes as the primary frequencies vary at a constant ratio. The phase of the emission through the basilar-membrane mode remains approximately constant, whereas that of the emission through the Reissner’s membrane mode changes by several cycles.

