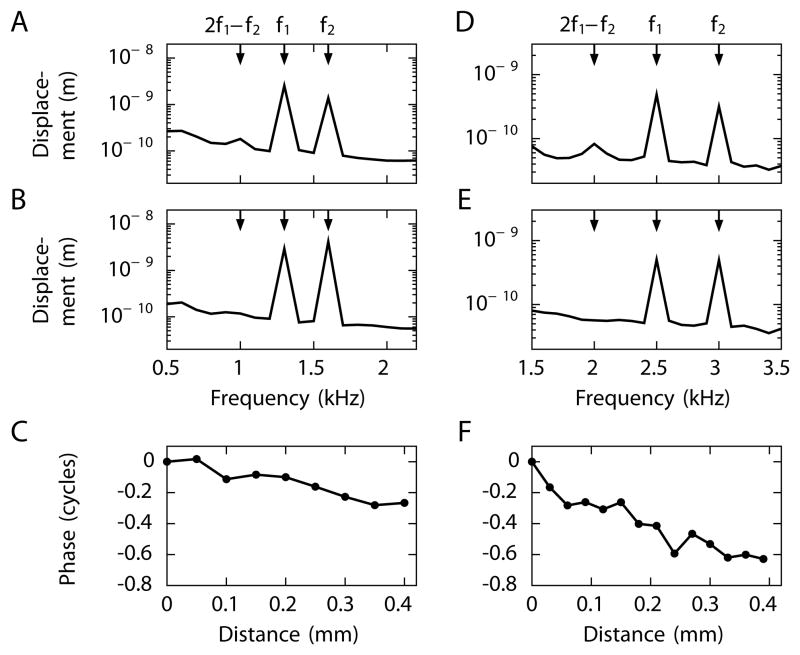
Figure 6. Measurement of distortion-product propagation along Reissner’s membrane.
We show exemplary results from one of three successful in vivo measurements from the chinchilla. (A) The frequency spectrum during stimulation at the primary frequencies f1 = 1.3 kHz and f2 = 1.6 kHz shows the lower-sideband cubic distortion product 2f1 − f2 = 1 kHz. The upper-sideband cubic distortion is weak and comparable to the noise floor. (B) The distortion product disappears after the animal has been sacrificed. (C) Scanning along Reissner’s membrane at the distortion-product frequency 2f1 − f2 reveals a progressive decrease of the signal’s phase, an indication of a traveling wave moving from base to apex. (D) Stimulation at f1 = 2.5 kHz and f2 = 3 kHz evokes the lower-sideband cubic distortion product 2f1 − f2 = 2 kHz. (E) The distortion product vanishes in a dead animal. (F) The phase decline again implies that the distortion product 2f1 − f2 propagates as a forward traveling wave on Reissner’s membrane.

