
Figure 2.
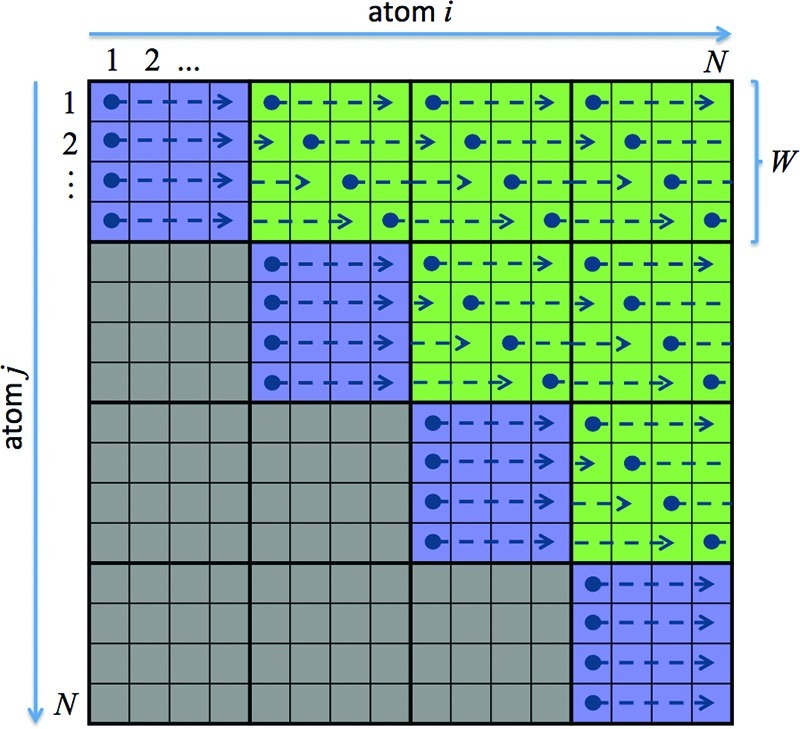
Schematic representation of the work-load distribution for the calculation of nonbond forces with N atoms. Each square represents the interactions between two atoms i and j for which the resulting forces need to be evaluated. These are grouped together in tiles of size W × W that are each assigned to an independent warp. Due to symmetry, only the blue diagonal tiles and the green off-diagonal tiles need to be considered for the calculation. For details, see the text.