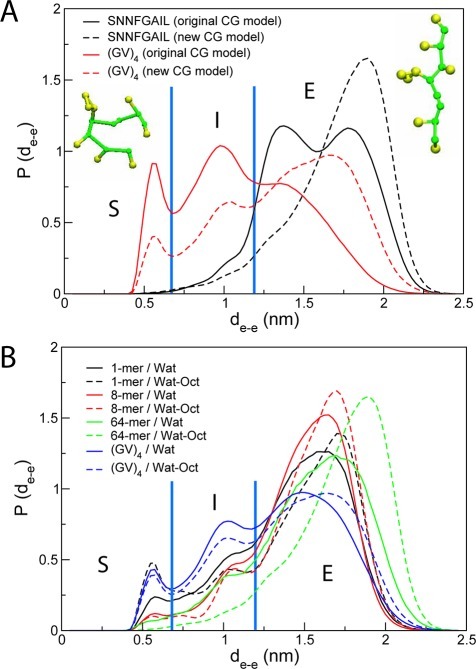
Figure 10.
Distribution of end-to-end distance of SNNFGAIL and (GV)4 peptides. (A) Distribution of dee of 64 SNNFGAIL and (GV)4 at water–octance interface using the original and new CG models. Representative snapshots of SNNFGAIL in short and extended conformations are shown. Vertical lines at dee = 0.66 and 1.2 nm highlight the boundaries separating short, intermediate, and extended conformations. (B) Distribution of dee of SNNFGAIL at different concentration in water and at water–octane interface computed with the new model. Distribution of dee of 64 (GV)4 is also shown in water and at water–octane interface computed with the new model.

