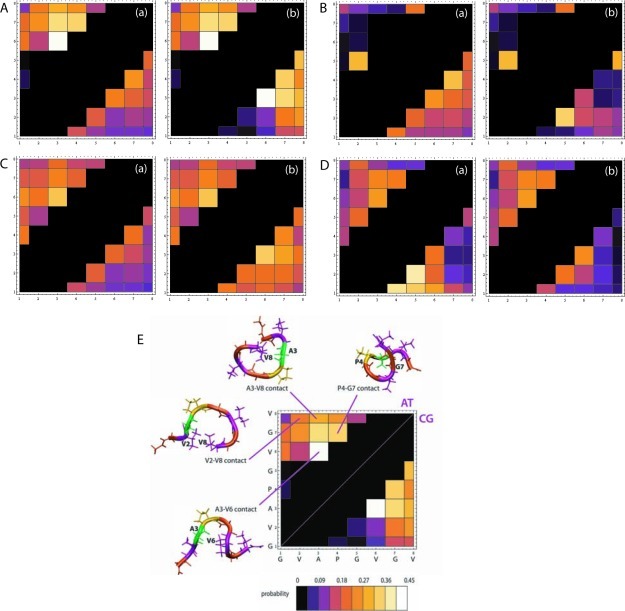
Figure 4.
Backbone beads contact maps at 305 K. Each square in the matrix (i,j) corresponds to a contact between the BB of residues i and j: (A) GVAPGVGV, (B) GVPGVPGV, (C) (GV)4, and (D) SNNFGAIL. (E) Representative snapshots of GVAPGVGV showing the presence of significantly populated contacts. In the color scheme, each color represents a range of probabilities of contact formation. On each map, the atomistic map lies above the diagonal, and the corresponding CG map, obtained from the simulations using either original MARTINI model (a) or the new model with the addition of dihedral potentials (b), lies below the diagonal.

