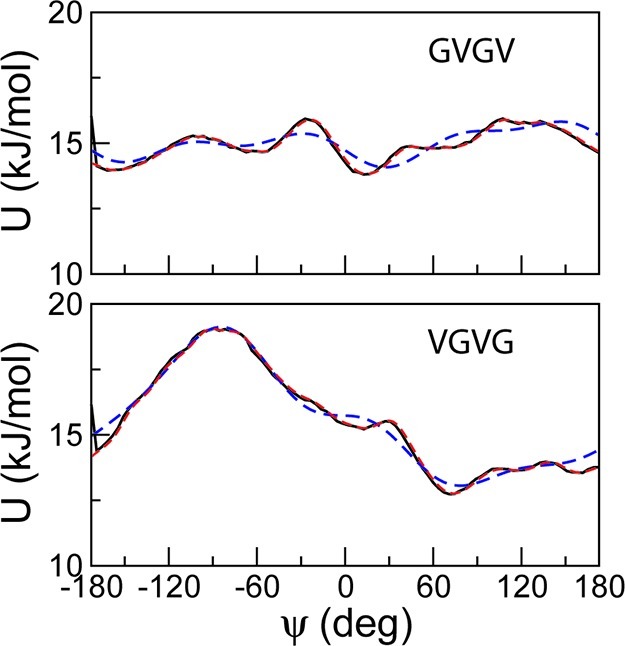
Figure 7.

The potentials of mean force (black solid lines) and the fitting energy functions (blue dotted lines) of the GVGV and VGVG tetrapeptides. The fits with the use of numerical tables are also shown (red dotted lines). The potentials of mean force were extracted from the probability distributions of the dihedral angles calculated from atomistic trajectories.
