Figure 1.
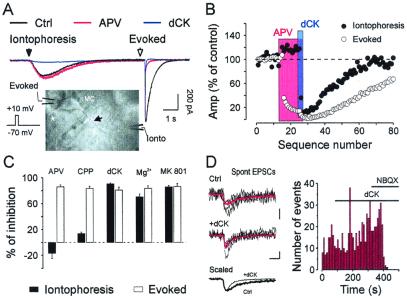
MC lateral dendrites express NMDA receptors with unusual pharmacology. (A) Sequential iontophoresis of glutamate and voltage steps were performed on a MC. Brief glutamate application (filled arrowhead, 500 ms) elicited a direct inward current while a short depolarization applied through the recording electrode (open arrowhead; depolarizing currents were blanked) induced an evoked inward current. Recordings were performed in control conditions (Ctrl: black trace; 0 Mg2+, 0.5 μM TTX, 10 μM BMI, 100 μM PTX, 10 μM NBQX). Red trace indicates application of d,l-APV (100 μM), and blue trace indicates application of 5,7-dCK (15 μM). Each trace is the average of five sweeps. (Inset) Infrared differential interference contrast image of a MC showing a lateral dendrite (arrow), the axon (*) and the location of the recording and ejecting pipettes. (B) Time course of the experiment illustrated in A. The colored boxes represent the duration of bath applications of the antagonists. (C) Summary graph showing the percentage of blockage induced by different NMDA receptor antagonists on iontophoretic (filled columns) and voltage-evoked (open columns) responses. Cells were recorded in the same external medium as in A supplemented with different NMDA receptor antagonists. The application of d,l-APV (100 μM) induced a clear blockade of the evoked response whereas iontophoretic responses were slightly potentiated (not statistically significant). Application of 1.3 mM Mg2+ inhibited both responses (a mean reduction of 70 ± 4%, P < 0.0001, n = 10 and 83 ± 4%, P < 0.009, n = 6, for iontophoresis and evoked responses, respectively). Application of 25 μM MK-801 also inhibited both responses (a mean reduction of 86 ± 2%, P < 0.0001, n = 12 and 86 ± 5%, P < 0.04, n = 6, for, respectively, iontophoresis and evoked responses). For iontophoresis, the control medium was supplemented with d,l-APV (100 μM). (D) A MC exhibits spontaneous EPSCs (spont EPSCs) mediated in part by APV-resistant NMDA receptors. MC recorded under control conditions: 0 Mg2+, 10 μM BMI, 100 μM PTX, 10 μM NBQX, and 100 μM d,l-APV showed spontaneous EPSCs (Top, the red trace represents the average of 50 events whereas the other traces represent single events). Bath application of 5,7-dCK (15 μM) did not affect their frequency (see histogram; bin 10 s) but decreased their decay time constant (Middle; the red trace represents the average of 70 events). (Bottom) The two averaged traces are scaled to match peak amplitudes. The remaining component of the EPSC is mediated by the non-NMDA receptors because they were totally blocked by NBQX (10 μM). (Scale bars: 2 ms and 10 pA; see Table 1, which is published as supplemental data on the PNAS web site, www.pnas.org.)

