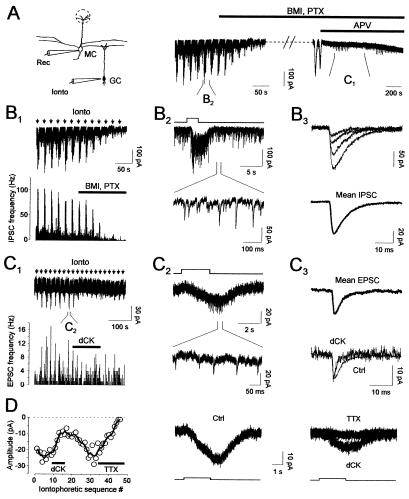
Figure 4.
Stimulation of GC elicited glutamate release onto MC. (A) MC are recorded while GC are stimulated by the iontophoresis of glutamate. Traces represent the time course of the experiment and were cut during application of BMI (10 μM) and PTX (100 μM) because they produced large inward currents that were blocked by d,l-APV (100 μM). (B 1–3) GC stimulation increases GABA release onto MC. (B1) Experiment performed in 0-Mg2+ during iontophoresis stimulations (black arrows). The histogram represents the IPSC frequency during the recording (bin 1 s). BMI/PTX reduced those events. (B2) The stimulation increases the IPSC frequency (Upper, see also the histogram in B1; the step represents iontophoretical applications). (Lower) Shown is an expanded time scale part of the upper trace showing individual synaptic events. (B3) Unitary IPSC (Upper) and the average of 90 events (Lower) are presented. (C 1–3) GC stimulation increases glutamate release onto MC. (C1) The same cell as in B was recorded in: 0 Mg2+, 10 μM BMI, 100 μM PTX, and 100 μM d,l-APV (black arrows indicate iontophoretic stimulations). The histogram represents EPSC frequency during the recording (bin 1 s). The bar shows the duration of dCK (15 μM) application. (C2) Traces showing the effect of one iontophoretic stimulation. Stimulation of GC induced a slow inward current (Upper) on the top of which discrete EPSCs could be seen (lower trace represents an expanded part of the upper one; see also histogram in C1; the step represents the iontophoretic application). (C3) Averages of EPSC recorded with or without dCK (15 μM). (Upper) Average of 35 events recorded before dCK application. (Lower) Changes in the decay time after dCK application (the average in dCK represents the average of 20 events). (D) (Left) Graph represents the amplitude of the iontophoretic evoked inward current recorded during the time course of the experiment depicted in C1. Bath application of dCK (15 μM) revealed that this current was mediated in part by APV-resistant NMDA receptors. After washout of this drug, bath application of TTX (0.5 μM) completely abolished the current, confirming that it was due to the excitation of GC rather than a direct effect on the MC dendrites. The traces showing the drug effects are the average of five sweeps.

