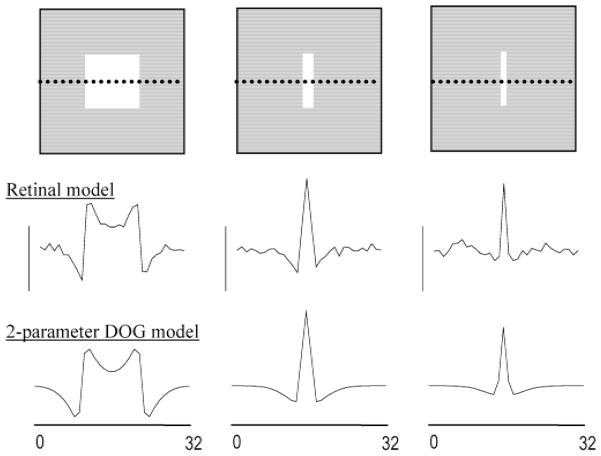
Fig. 3.
Consistency of the retinal model with the center/surround organization of cat alpha ganglion cells. Top row: The retinal model was stimulated with low intensity bars of varying thickness. Middle row: Plateau firing rates of the ganglion cells along a cross section passing through the center of each bar (dotted line in top panels). Bottom row: Firing rate profile predicted by a two-parameter Difference-of-Gaussians (DOG) model in which the ratio of center-to-surround strengths and radii were fixed at published values for cat alpha cells (Troy et al., 1993).

