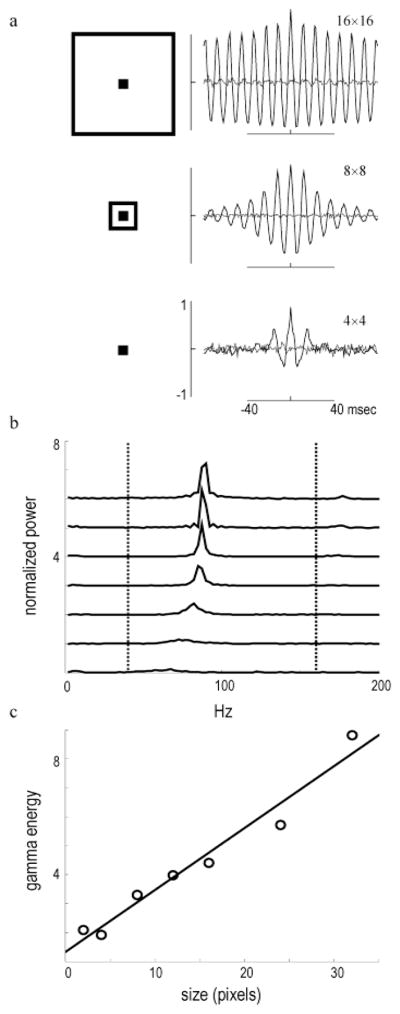
Fig. 5.

HFOPs in the retinal model are proportional to stimulus size. (a) mCCHs measured during the plateau response for a 2 × 2 array of ganglion cells centered within stimuli of increasing size (see illustrations). Stimulus size (in pixels) indicated to upper right of each mCCH. HFOPs increased sharply with stimulus size. Shift predictors were negligible. (b) Power spectra of model mCCHs for a range of spot sizes (2 × 2, 4 × 4, 6 × 6, 8 × 8, 12 × 12, 16 × 16, 24 × 24, and 32 × 32 pixels). (c) Total energy of the model HFOPs in the gamma-frequency band (40–160 Hz) increased approximately linearly with spot diameter (best fit regression line shown). Each pixel corresponded to approximately of a degree in the area centralis. A similar dependence on spot size is exhibited by HFOPs between cat ganglion cells (Neuenschwander et al., 1999).
