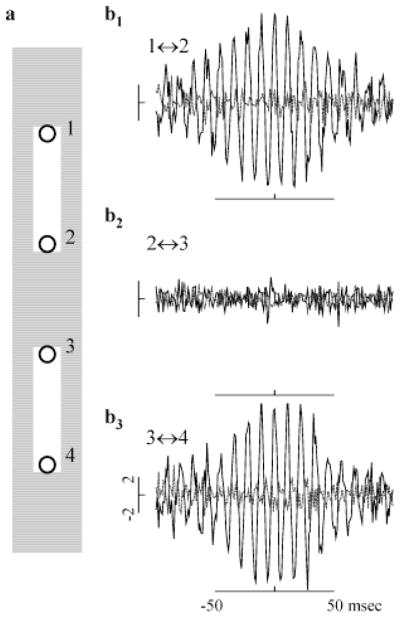
Fig. 6.
HFOPs in the retinal model are stimulus specific. (a) Location of stimuli (white rectangles) relative to the receptive-field centers of recorded ganglion cells, labeled 1–4 (circles). (b1–b3) CCHs (solid black lines) and associated shift predictors (dashed gray lines) computed during the plateau portion of the response for pairs of ganglion cells at opposite ends of the same bar or at opposing tips of separate bars. Correlations expressed as a fraction of the baseline synchrony. All ganglion cell pairs were separated by seven GC receptive-field diameters. (b1) pair 1 ↔ 2 from upper bar; (b2) pair 2 ↔ 3 from separate bars; (b3) pair 3 ↔ 4 from lower bar. Correlations were only significant between pairs from the same bar, as with HFOPs between cat ganglion cells (Neuenschwander et al., 1996).

