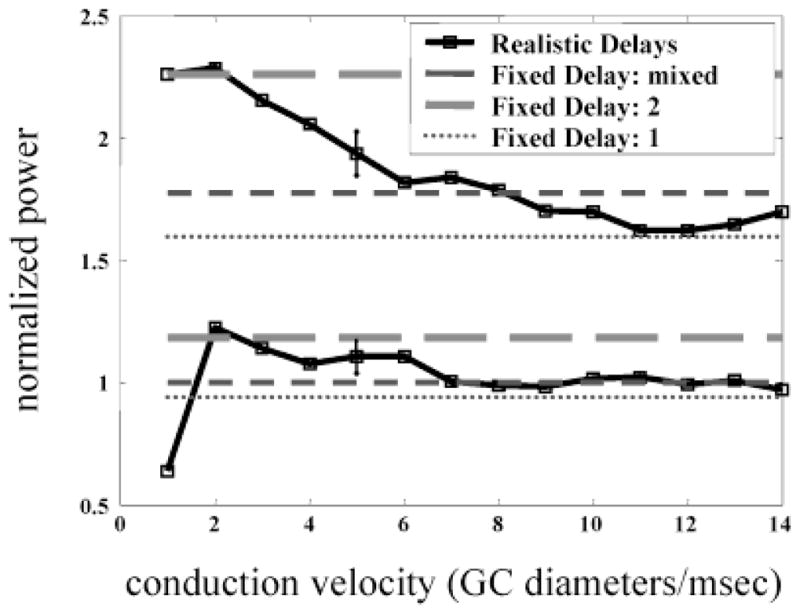
Fig. 9.

HFOPs in the retinal model increase with average axonal delay. Total energy in the gamma-frequency band (40–160 Hz) is plotted either as a function of axonal conduction velocity (solid lines), or for different values of a fixed axonal conduction delay (fixed delay = 1, thin line, short dashes; fixed delay = 2, intermediate thickness and dash length; mixed delay, fixed delay = 1 for PA ↔ PA connections, 2 for all other axonal connections, thickest line, longest dashes). Total gamma power expressed as a fraction of the baseline value obtained with the canonical model parameters (mixed delay). In response to a constant stimulus centered over the recorded ganglion cells (size = 8 × 8 GC diameters, , solid lines), total power in the gamma-frequency band during the plateau portion of the response declined as the average conduction delay was reduced. A similar effect was seen during background activity (lower set of curves). All connections had a minimum fixed delay of 1 ms.
