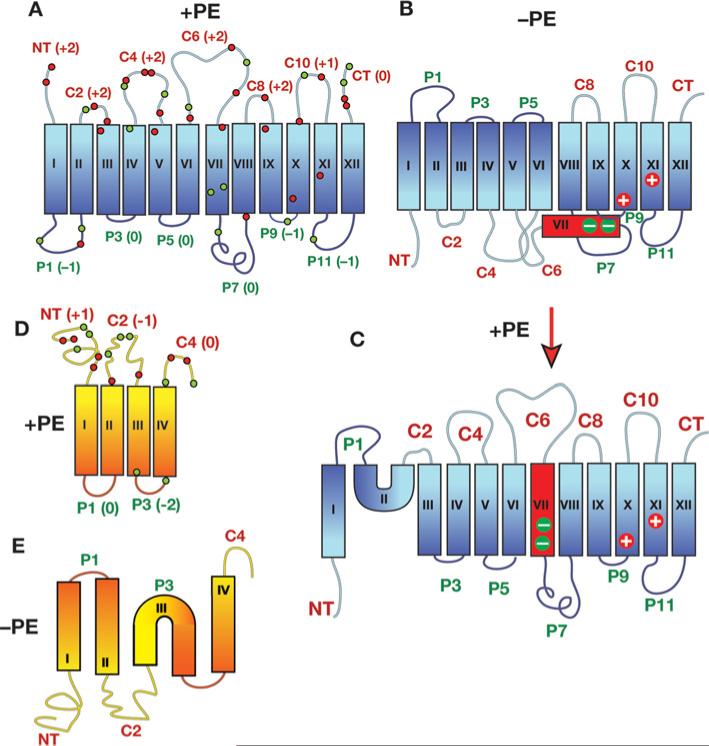
Figure 2. TM organization of secondary transporters as a function of membrane lipid composition.
The top of each structure faces the cytoplasm. Blue, red and yellow/orange rectangles denote TMs numbered sequentially by Roman numerals. N- and C-terminal domains are labelled as NT and CT respectively. Extramembrane domains are labelled according to their exposure to the cytoplasm (C) or periplasm (P) in PE-containing cells. (A) Topology organization of LacY as determined in PE-containing (+PE) cells is depicted. The net charge of each extramembrane domain is noted next to the domain name, and the approximate positions of charged residues throughout the protein are indicated by green (negative charge) and red (positive charge) dots. (B) Topology organization of LacY as determined in PE-lacking (–PE) cells is shown. TM VII (red) exposure to the periplasm results in the loss of salt bridges between the two aspartate residues in TM VII with positively charged amino acids in TM X and TM XI. (C) Topology organization of LacY as determined in cells where assembly of LacY initially occurred in the absence of PE followed by the induction of PE synthesis in the absence of new LacY synthesis. (D) Topology organization of PheP (topology of lipid-insensitive region TM V-CT not shown) as determined in PE-containing cells is shown with labelling of domains following that described in (A). (E) Topology organization of PheP as determined in cells lacking PE. Note that the topological organization of GabP is the same as that of PheP with a slightly different distribution of charged residues. Modified from [9] with permission. © 2009 The American Society for Biochemistry and Molecular Biology.

