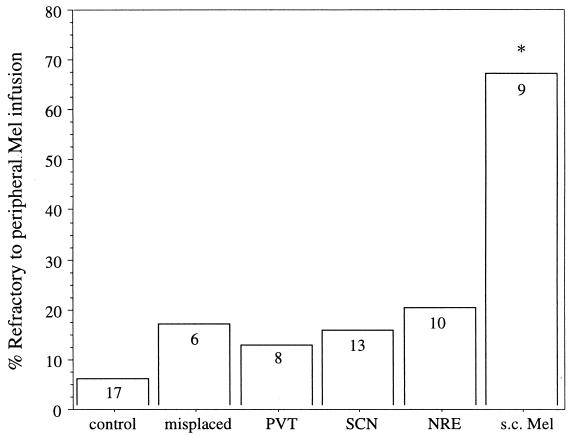
Figure 4.
Percentage of each group that was refractory to the s.c. Mel infusions. Sample size is indicated within each bar. Control group combines animals that received beeswax brain implants and those implanted with an empty s.c. capsule. *, Significantly different from all other groups (P ≤ 0.03).

