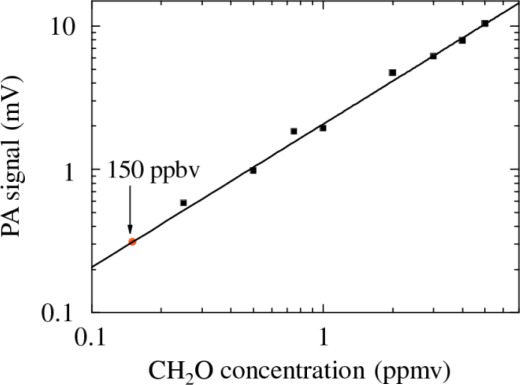
Figure 4.
PA signal versus CH2O concentration. The symbols represent experimental data, solid line is a linear fit. The error bars corresponding to the uncertainty on PA signal have the same dimensions of the symbols. The vertical arrow marks the noise equivalent (signal-to-noise ratio of 1) minimum detection limit of 150 ppbv.

