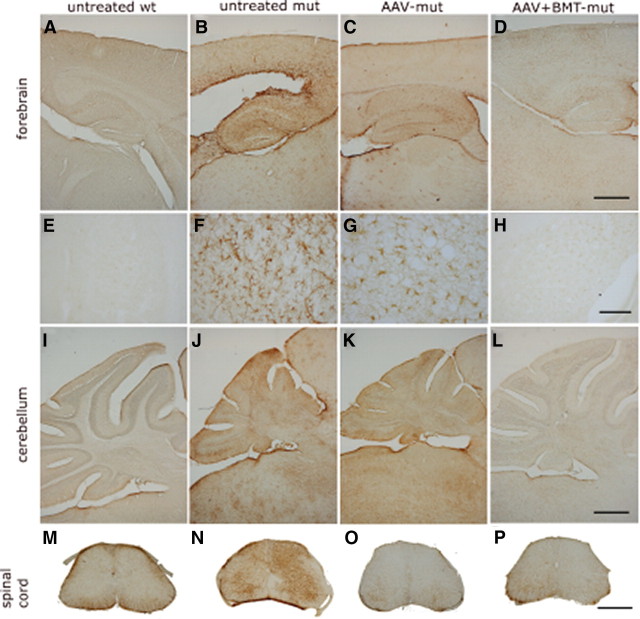
Figure 10.
GFAP immunohistochemistry. Representative images of GFAP staining of brain and spinal cords are shown. Untreated mut animals have higher GFAP immunoreactivity in all the regions of the CNS (B, F, J, N) compared with untreated wt animals (A, E, I, M). Animals in the AAV-mut group (C, G, K, O) appear to have similar or slightly decreased GFAP staining compared with the untreated mut group. The AAV+BMT-mut group (D, H, L, P) has less intense GFAP staining compared with the untreated mut and AAV-mut groups. High-magnification images (E–H) from the cortex show a characteristic activated astrocyte morphology. The spinal cords of the untreated wt group have minimal GFAP staining (M) compared with the untreated mut group (N). The spinal cords of the AAV-mut (O) and AAV+BMT-mut (P) groups stain with similar intensity as that of the untreated wt group. A–D and I–P were imaged at same magnification. Scale bars: D, L, P, ∼600 μm. E–H were imaged at same magnification. Scale bar: H, ∼25 μm.

